A Gantt chart is a horizontal bar chart that illustrates a project schedule, showing the start and end dates of individual tasks or activities and their dependencies.
Each chart represents a task; dependencies between tasks are represented by arrows connecting the bars, indicating which tasks must be completed before others can begin. This allows project managers to visualize and determine the project’s critical path, which is the sequence of tasks that must be completed on time to ensure the project is on schedule.
Gantt chart overview
| Visualize project timelines and task dependencies. | |
|
|
|
Who invented the Gantt chart?
The Gantt chart is named after Henry Laurence Gantt, an American mechanical engineer, who created a tool for scheduling and tracking production in manufacturing plants in the early 1900s.
He invented the chart as a way to visualize project schedules, which was a significant advancement in project management at the time. Initially used primarily in industrial and military projects, Gantt charts have since become a standard tool in project management across various industries.
Gantt charts can be created using specialized software, such as project management tools, or by hand with pen and paper.
What is a Gantt chart used for?
A Gantt chart is used in project management for project planning, resource allocation, timeline management, progress tracking, and communication. They are particularly useful for project managers, since people in that role have the responsibility of ensuring projects are completed on time and within budget.
Project managers can use a Gantt chart to break down a project into smaller tasks, activities, or events and assign them to team members with specific start and end dates. The Gantt chart can then be used to communicate the project schedule and progress to stakeholders, team members, and clients to ensure that deadlines are met.
Project managers can use a Gantt chart to visualize the project timeline, identify potential delays or bottlenecks, and adjust schedules as needed. Gantt charts can also be used to track the completion of each task or activity, providing a real-time view of the project’s progress.
What are the main benefits of using Gantt charts?
With Gantt charts, each team member knows who should do what. This helps the team stay efficient and boosts collaboration, which ultimately leads to a better project outcome.
But the benefits of Gantt charts are not limited to these factors alone. Here are other benefits of Gantt charts in project management.
Resource planning and allocation
To avoid overloading people and processes, Gantt charts provide a clear visual representation of project timelines and task dependencies, making it easier for project managers to allocate resources, such as team members, materials, and equipment, and ensure they are used efficiently throughout the project.
Visualization
Gantt chart consolidates all project information in an easy-to-understand dashboard. It gives teams a project overview, including tasks, assignees, due dates, and other critical details.
A Gantt chart’s visual representation simplifies complex projects and their key performance indicators, making it easy for project managers and team members to see the project’s progress, milestones, and deadlines.
Progress tracking
Project managers can monitor the progress of scheduled tasks as team members complete their tasks and the overall project percentage increases. This is achieved through visual indicators such as bars and milestones that represent each task’s duration and completion status.
Dependency tracking
Task dependencies are the relationships between individual tasks that determine the order in which they should be completed. For example, some tasks can start once others have been completed, while others must be completed concurrently.
By visualizing task dependencies in a Gantt chart, project managers can understand the critical path, avoid delays, and allocate resources effectively.
Communication and collaboration
Gantt charts are valuable tools for project communication and collaboration. They provide a shared view of the project’s progress, allowing project managers, team members, and stakeholders to communicate and collaborate more effectively.
How does a Gantt chart work?
Gantt charts use horizontal bars to represent each task’s duration and start and end dates. Some of the key steps to creating a Gantt chart include:
- Identify the tasks: Identify all tasks required to complete the project and define each task as having a specific deadline.
- Determine the task dependencies: Once the tasks have been identified, determine the dependencies between them to organize the order in which tasks must be completed and how long they will take.
- Assign resources: Assign resources to each task, including personnel, equipment, and materials required.
- Create the chart: Using a Gantt chart software or tool, create a horizontal bar chart with the timeline on the horizontal axis and the tasks on the vertical axis.
- Add task information: For each task, add relevant information such as the task name, the start and end date, the duration, the assigned resources, and other relevant details.
- Update and track progress: As the project progresses, update the Gantt chart to reflect the actual progress made. This can be done by shading or coloring completed tasks, adding notes, and adjusting timelines.
Key components of Gantt charts
Gantt charts consist of several elements that work together to ensure project success.
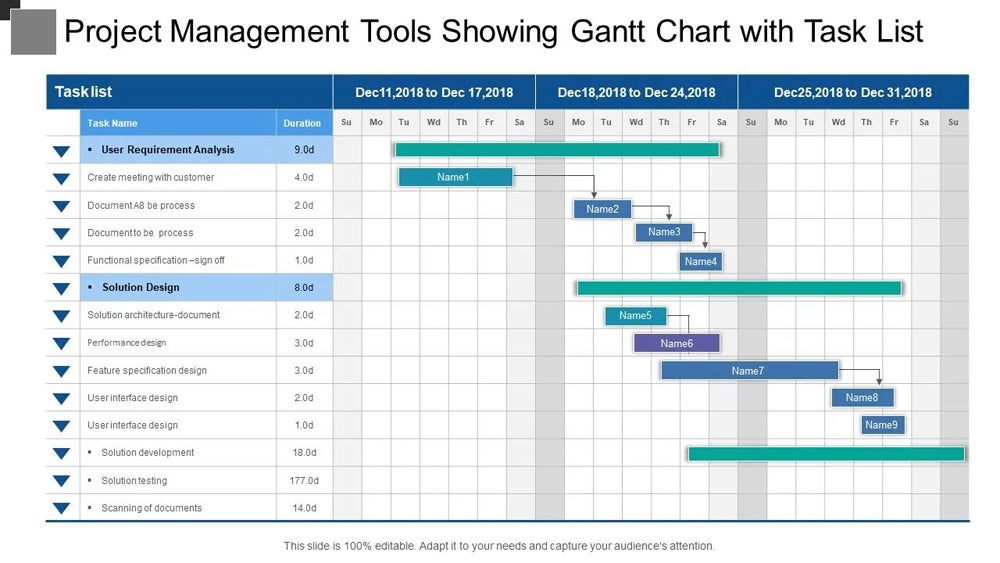
Task list
The task list is a vertical list of all tasks required to complete the project. Each task should be clearly defined and have a specific deadline.
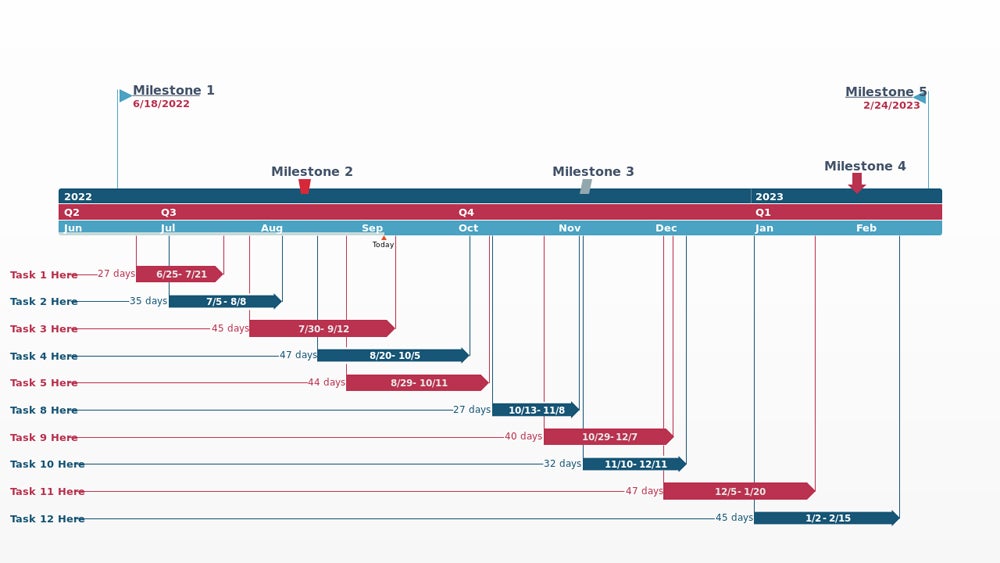
Timeline
The timeline is a horizontal axis that represents the duration of the project. Depending on the project’s duration, it is typically divided into days, weeks, or months.
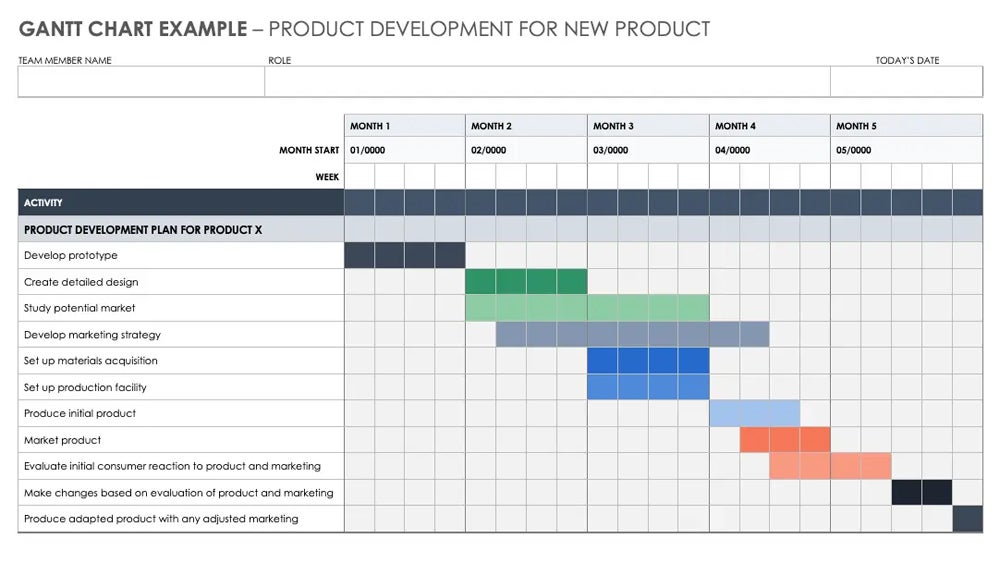
Bars
Bars are horizontal lines that represent the duration of each task. The task’s start date is indicated by the left end of the bar, while the end date is indicated by the right end of the bar. The length of the bar represents the duration of the task.
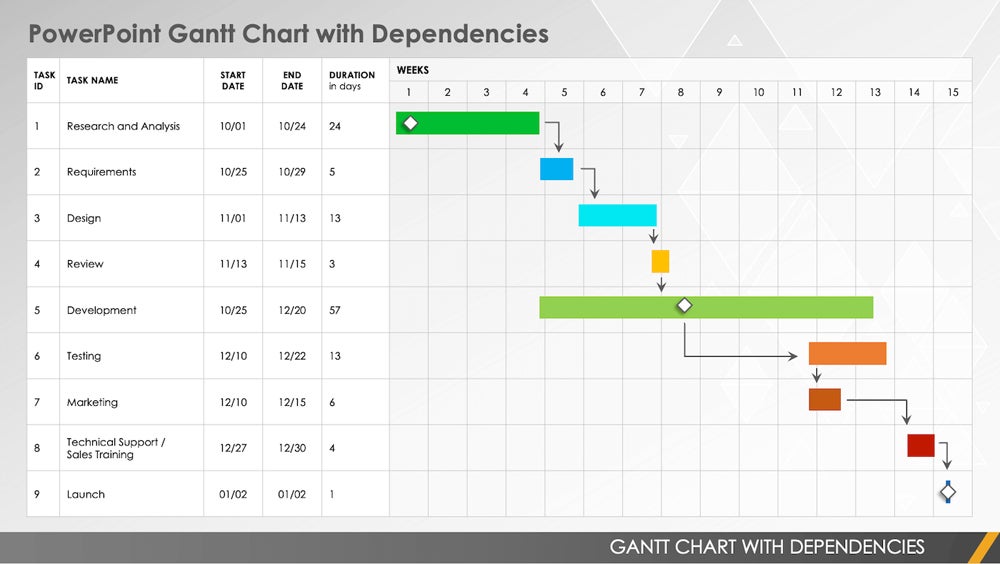
Dependencies
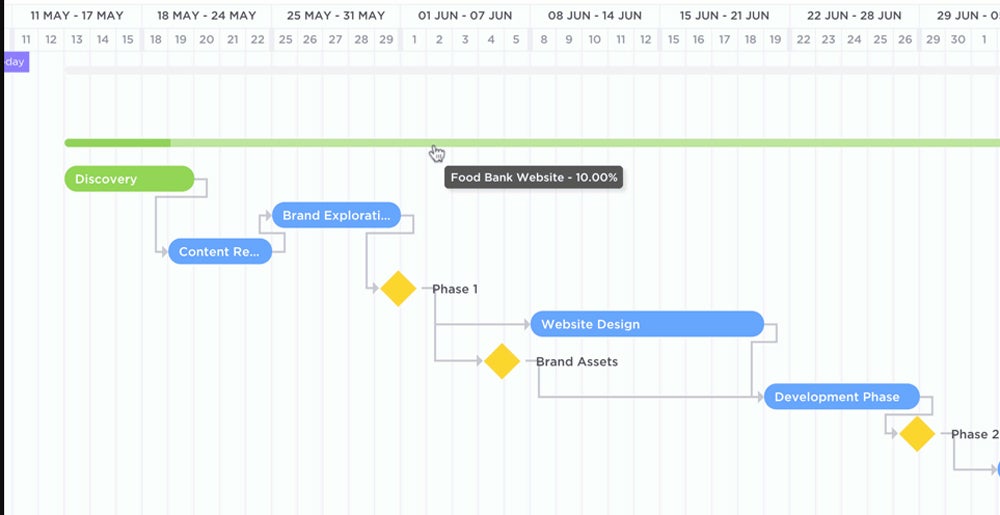
Dependencies are shown using arrows that link the bars representing the dependent tasks. Arrows indicate the relationship between tasks, such as:
- Finish to Start (FS): The predecessor must finish before the successor can start.
- Start to Start (SS): The predecessor must start before the successor can start.
- Finish to Finish (FF): The predecessor must finish before the successor can finish.
- Start to Finish (SF): The predecessor must start before the successor can finish.
Milestones
Milestones are significant events in the project, such as completing a major task or delivering a critical component. Diamonds represent milestones in the Gantt chart and are usually labeled with a specific date.
Progress bars
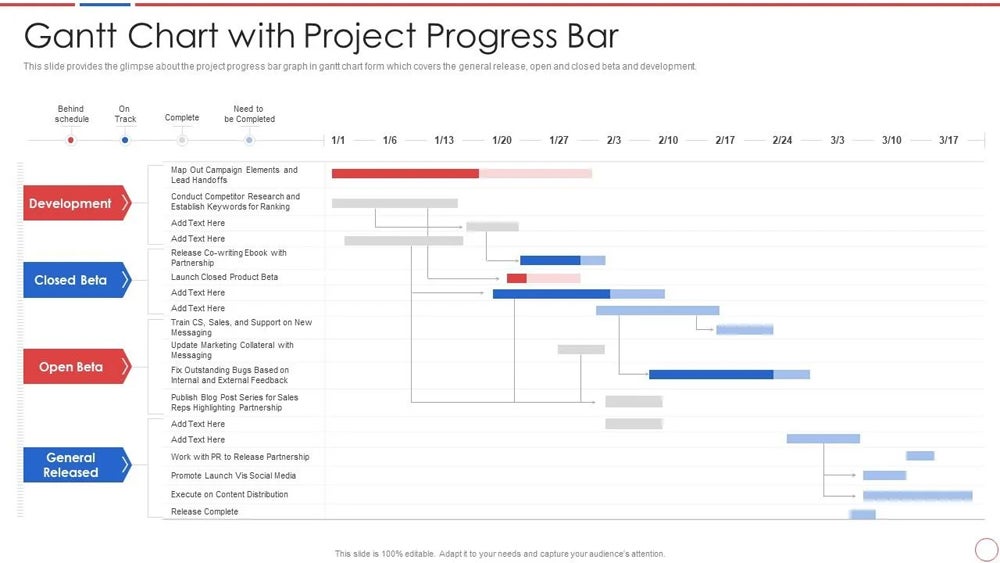
Progress bars are used to indicate the actual progress made on each task. They are typically shown as shaded areas within the bars representing the tasks.
Key takeaways
- A Gantt chart is a project management tool that displays the start and end dates of individual tasks, their dependencies, and the project’s overall timeline.
- A Gantt chart allows project managers to visually track progress, identify potential delays, and adjust timelines accordingly.
- Gantt charts can be created digitally using specialized software or manually with pen and paper.
- Gantt charts are not limited to a particular industry. Organizations looking to streamline their project management processes will find the tool beneficial. From construction to manufacturing to software development to event planning, a Gantt chart can be tailored to different industries and use cases.
With a Gantt chart, teams can plan, track, and manage their projects effectively. By visualizing the timeline of individual tasks and their dependencies, project managers can identify potential issues and adjust timelines as needed, which can help to ensure the project’s success.
Frequently asked questions
When should a Gantt chart not be used?
A Gantt chart should not be used in highly dynamic projects, as frequent changes can make it difficult to maintain. It’s also less suitable for projects with complex dependencies, where a network diagram or the Critical Path Method (CPM) might be more effective.
When should you use a Gantt chart?
A Gantt chart is best used in linear projects where tasks have a clear, sequential order. It is excellent for tracking task progress against the project timeline and highly useful for providing an easy-to-understand overview for stakeholders to monitor the project’s status.
What are the disadvantages of a Gantt chart?
The main drawback of a Gantt chart is its potential complexity, especially in large or intricate projects, where it can become difficult to manage. It requires frequent updates, which can be cumbersome if project timelines or tasks change often.
Are Gantt charts still used?
Gantt charts are still widely used in project management, especially in industries like construction, manufacturing, and event planning, where they provide a clear timeline and visual overview of project tasks. Many modern project management software solutions include Gantt chart functionality, making it easier to create, update, and maintain them.


